Dashboards
KubeStellar Klaude Console has 20 different dashboards. Each shows you different information about your Kubernetes clusters.
Main Dashboard
Route: /
This is your home page. It shows:
- Overview of all your clusters
- Cards you’ve chosen to see
- Quick stats at the top
- AI suggestions for what to look at
The main dashboard learns what you care about and shows those things first.
Dedicated Dashboards (19)
Clusters Dashboard
Route: /clusters
See all your Kubernetes clusters:
- Which clusters are healthy (green)
- Which clusters have problems (red)
- Which clusters are offline (gray)
- Quick links to each cluster’s native console
Best for: Checking if all your clusters are working
Workloads Dashboard
Route: /workloads
See all your running applications:
- Deployments and their status
- Pods that are having problems
- Which apps are healthy
Best for: Making sure your applications are running
Compute Dashboard
Route: /compute
See your compute resources:
- How many CPUs you have
- How much memory is available
- GPU usage (important for AI workloads!)
- Top pods using resources
Best for: Checking if you have enough resources
Storage Dashboard
Route: /storage
See your storage:
- Persistent Volume Claims (PVCs)
- Storage classes
- Which volumes are bound or pending
Best for: Managing disk space for your apps
Network Dashboard
Route: /network
See your networking:
- Services and their types
- LoadBalancers
- Ingresses
- Endpoints
Best for: Understanding how traffic flows
Events Dashboard
Route: /events
See what’s happening:
- Recent events from all clusters
- Warnings that need attention
- Normal events
- Filter by time or type
Best for: Troubleshooting when something goes wrong
Security Dashboard
Route: /security
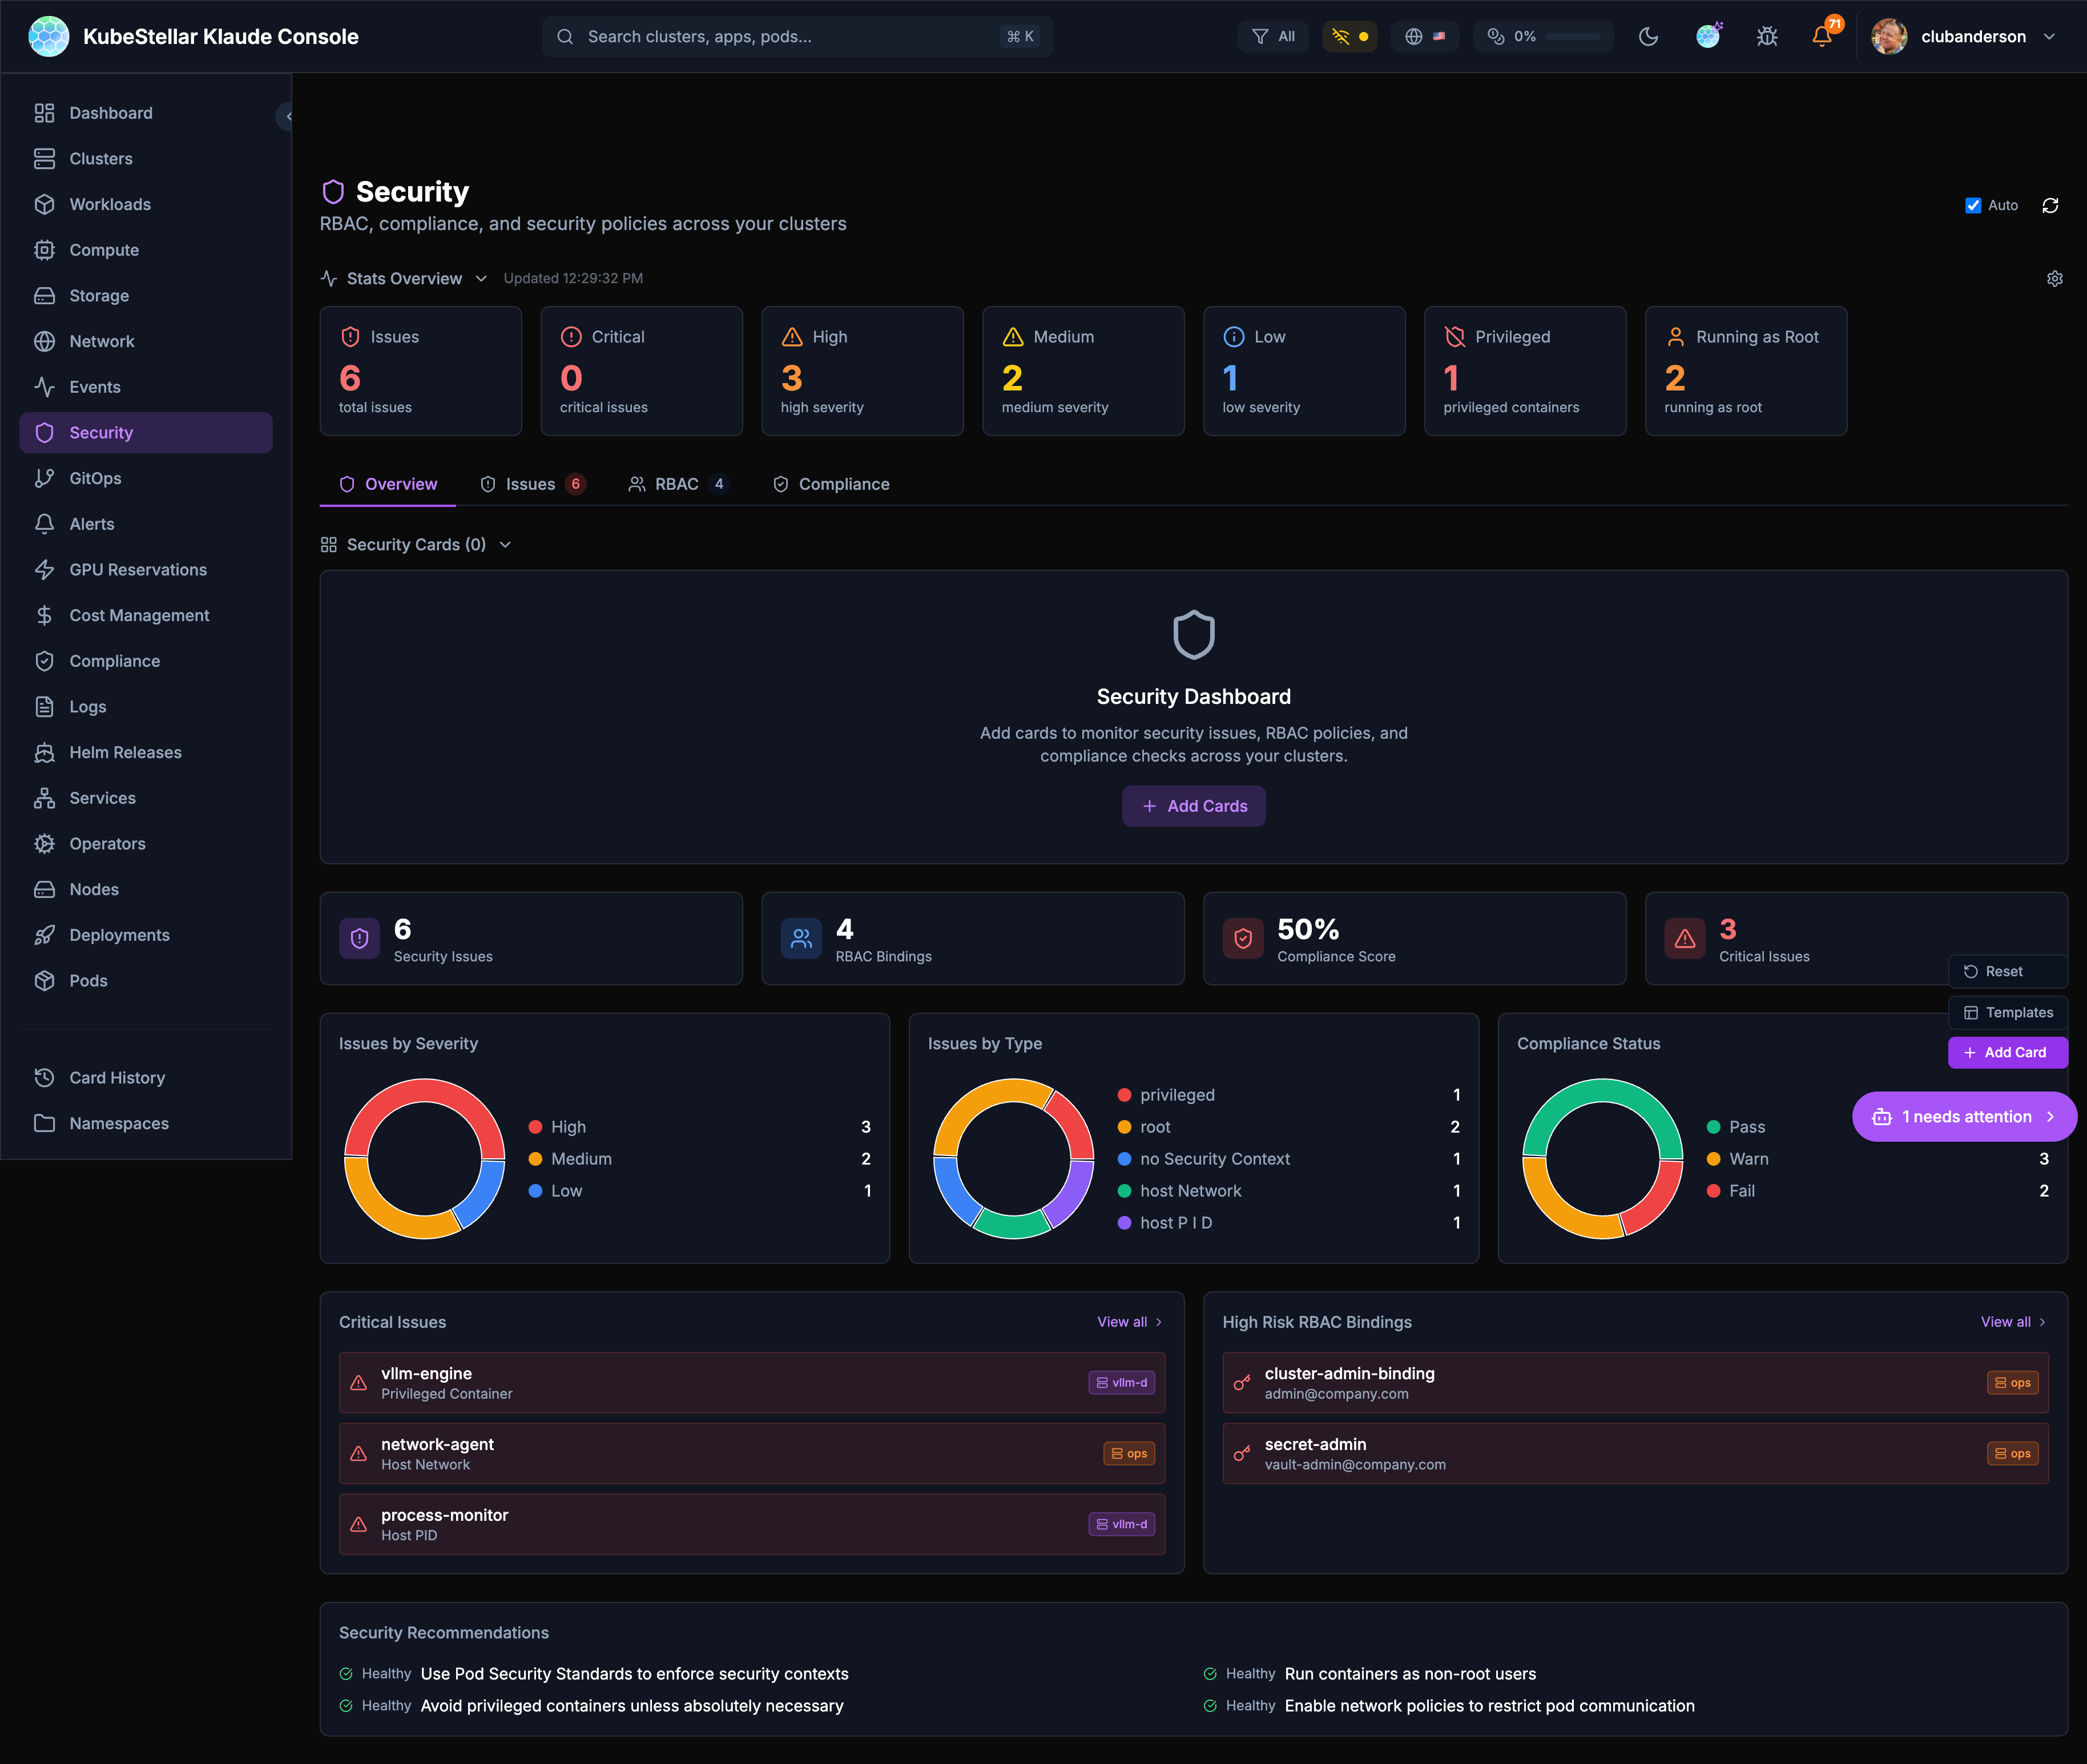
Find security issues:
- Containers running as root
- Privileged containers
- Missing security contexts
- Critical and high severity issues
Best for: Keeping your clusters secure
GitOps Dashboard
Route: /gitops
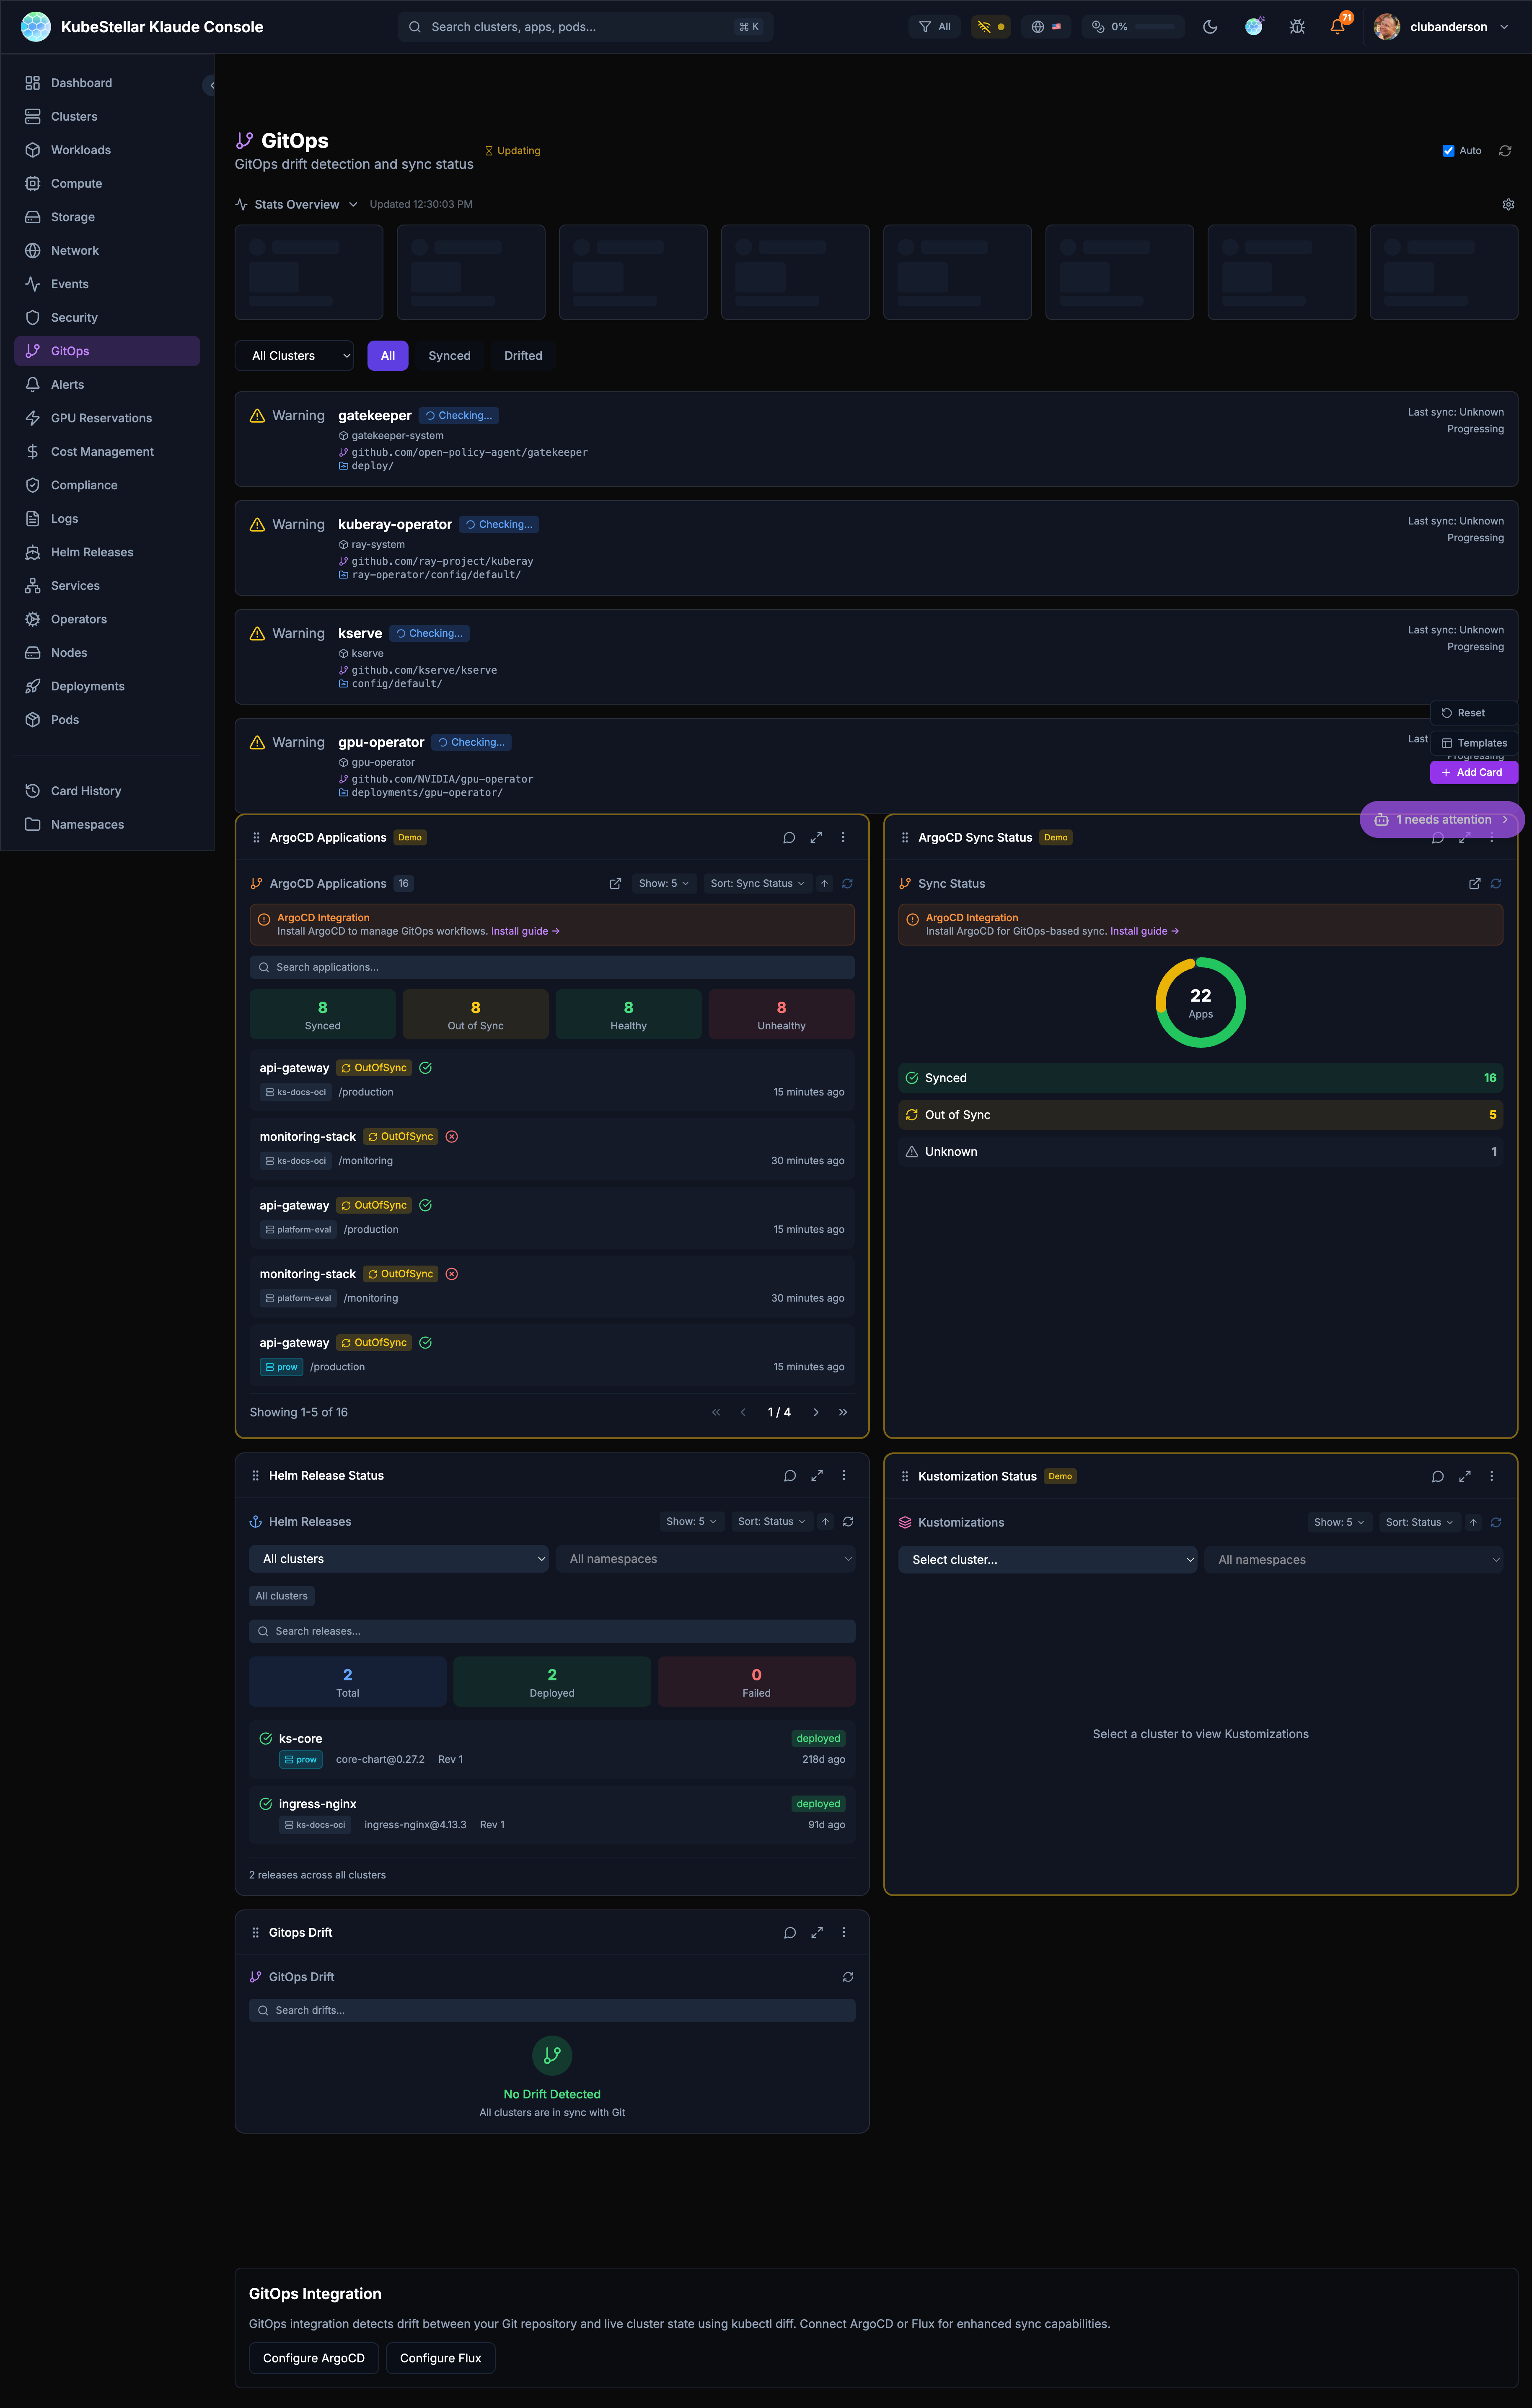
Manage GitOps:
- Helm releases and their status
- Kustomizations
- ArgoCD applications
- Drift detection (when clusters don’t match git)
Best for: Managing deployments from git
Alerts Dashboard
Route: /alerts
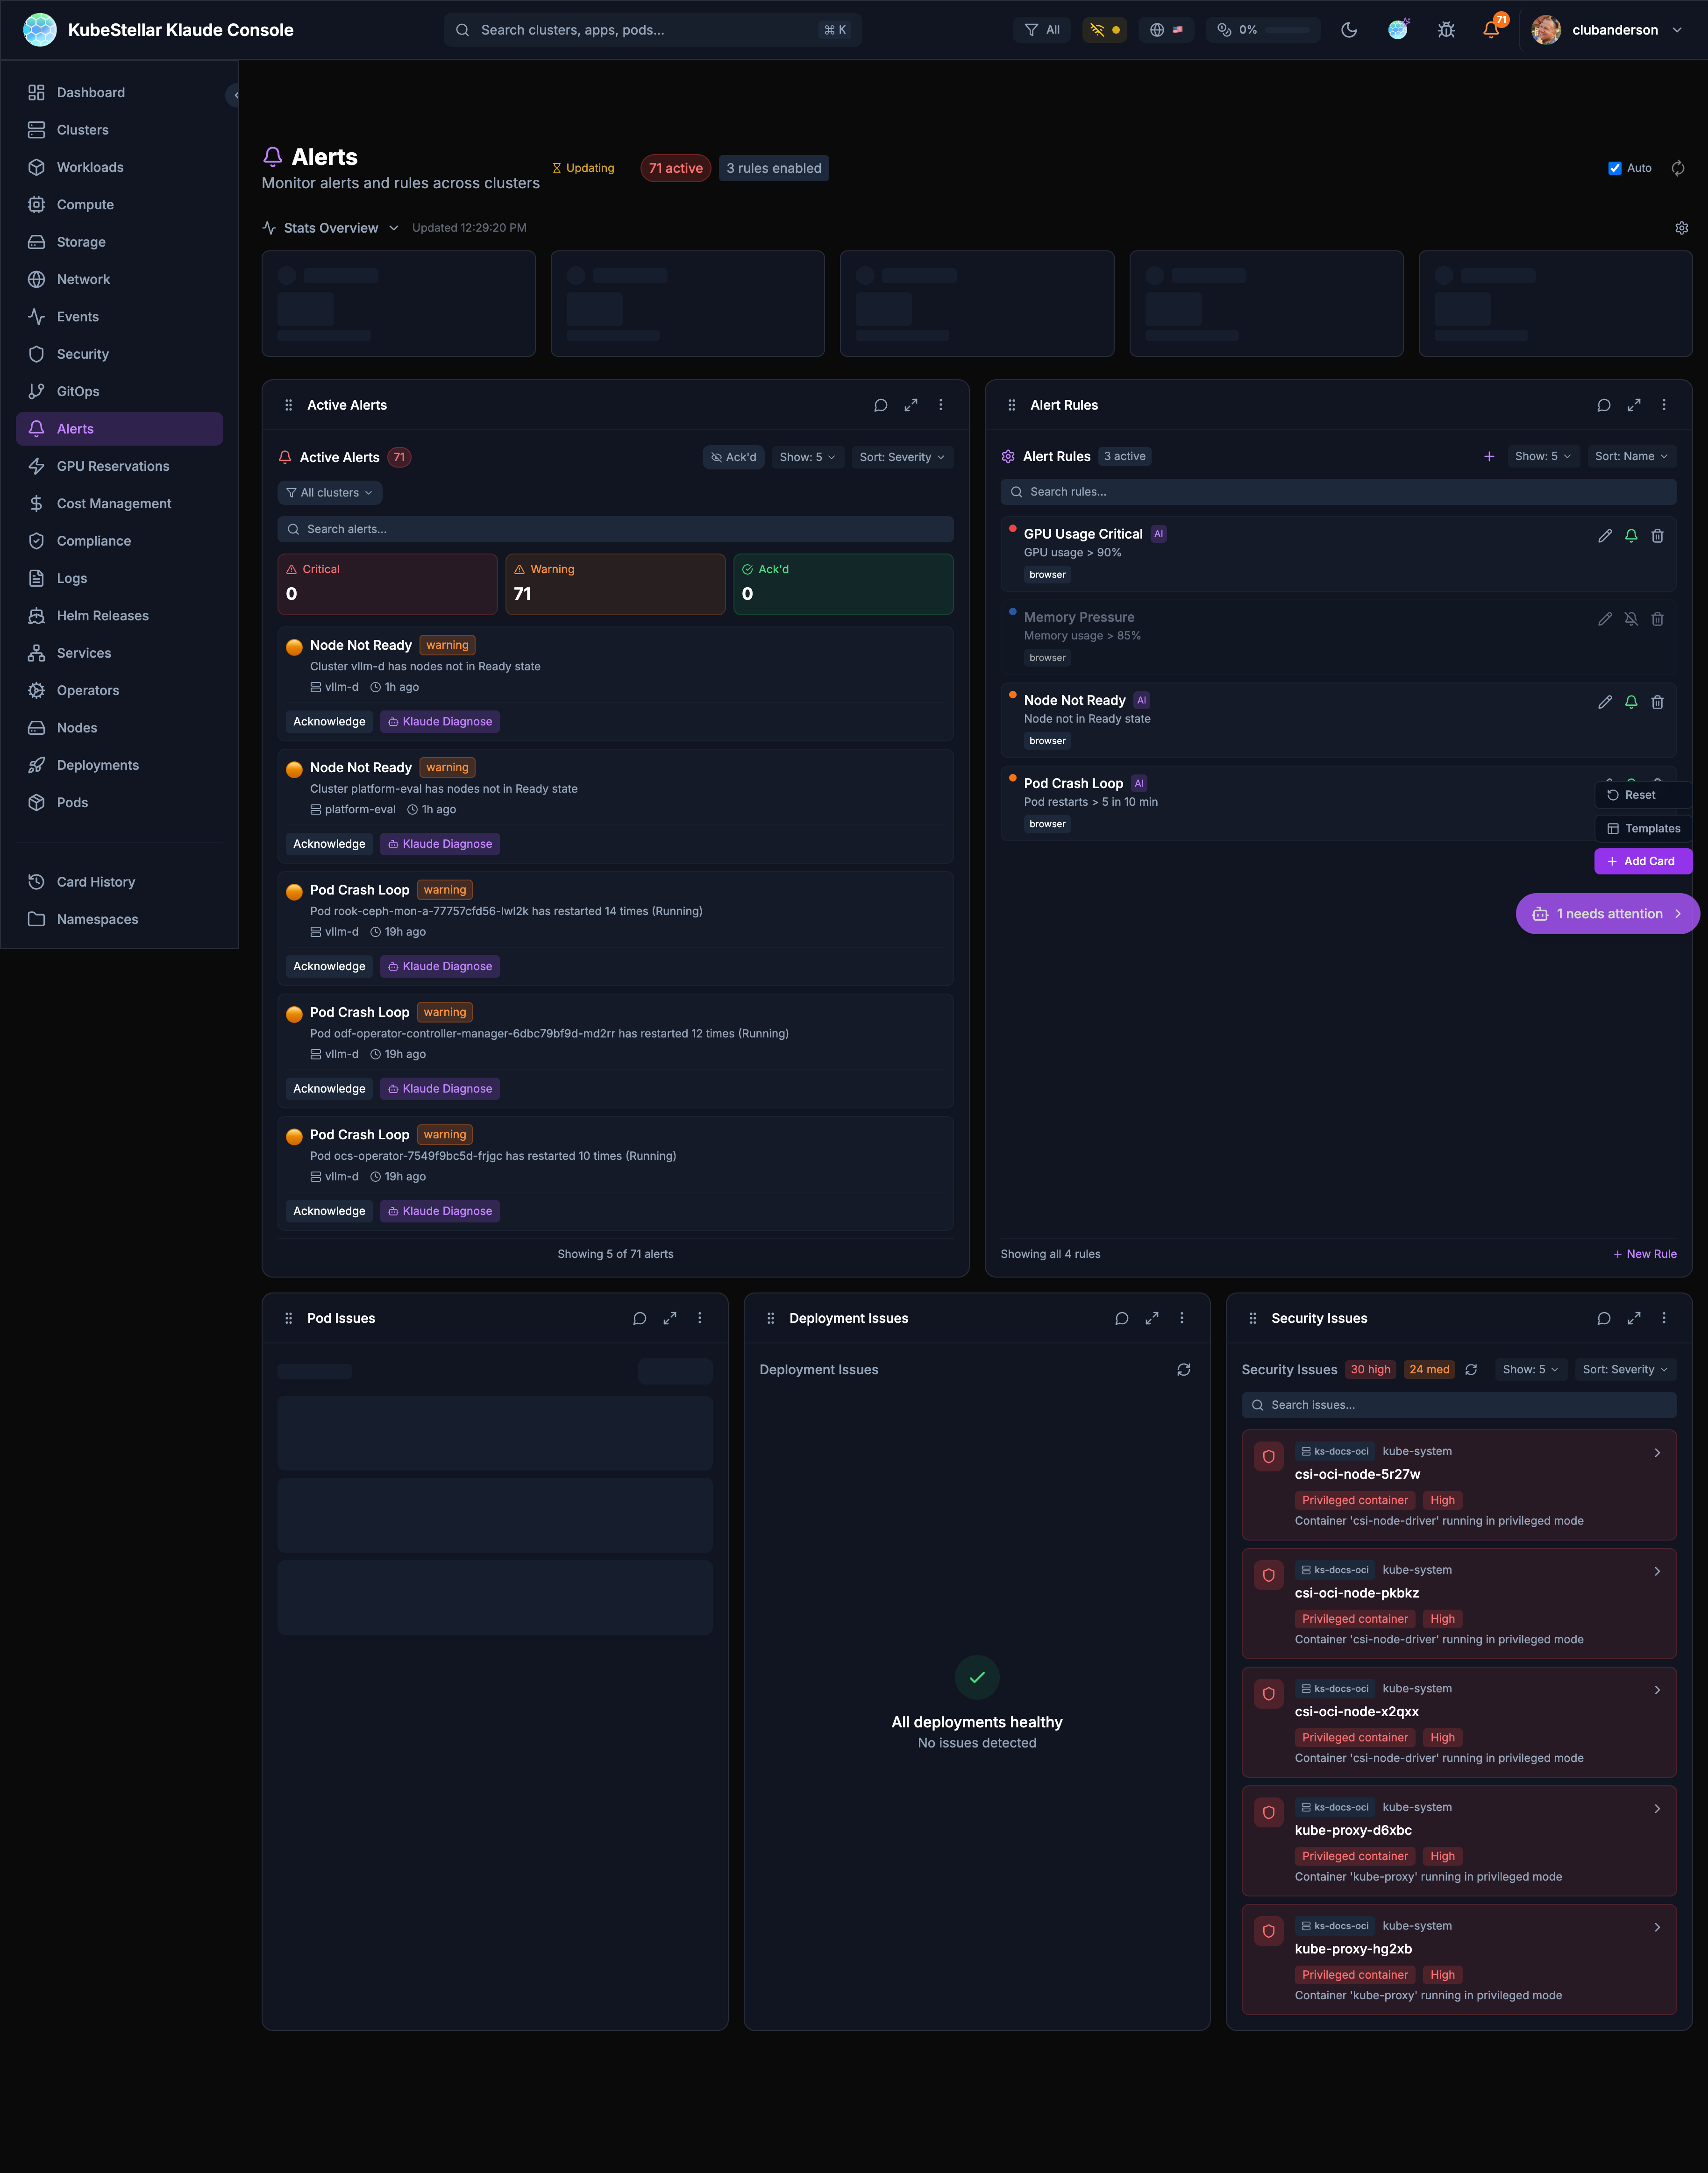
Manage alerts:
- Firing alerts
- Pending alerts
- Alert rules you’ve created
- Resolved alerts
Best for: Knowing when things need attention
GPU Reservations Dashboard
Route: /gpu-reservations
Manage GPUs:
- Which GPUs are available
- Who is using them
- Queue for GPU access
Best for: AI/ML teams sharing GPUs
Cost Management Dashboard
Route: /cost

Track your spending:
- Total estimated cost
- Cost per cluster
- Cost by resource type (CPU, memory, storage)
- OpenCost and Kubecost integration
Best for: Controlling cloud spending
Compliance Dashboard
Route: /compliance
Check compliance:
- Compliance score
- Passing and failing checks
- Critical findings
- Policy violations
Best for: Meeting security requirements
Logs Dashboard
Route: /logs
View logs:
- Container logs from any pod
- Filter by namespace or pod
- Search log content
Best for: Debugging application issues
Helm Releases Dashboard
Route: /helm
Manage Helm:
- All Helm releases
- Release history
- Values comparison
- Available upgrades
Best for: Managing Helm deployments
Services Dashboard
Route: /services
See all services:
- ClusterIP services
- LoadBalancer services
- NodePort services
- Endpoints
Best for: Understanding service networking
Operators Dashboard
Route: /operators
Manage operators:
- OLM operators
- Subscriptions
- Available updates
Best for: Managing cluster extensions
Nodes Dashboard
Route: /nodes
See your nodes:
- Node health status
- Resource usage per node
- Node labels and taints
Best for: Infrastructure monitoring
Deployments Dashboard
Route: /deployments
Focus on deployments:
- All deployments across clusters
- Replica counts
- Rollout status
Best for: Application deployment status
Pods Dashboard
Route: /pods
Focus on pods:
- All pods across clusters
- Pod status
- Restart counts
- Resource usage
Best for: Detailed pod troubleshooting
Utility Pages
These aren’t counted as dashboards but are useful:
| Page | Route | What it does |
|---|---|---|
| Card History | /history | See cards you’ve removed |
| Settings | /settings | Configure your preferences |
| User Management | /users | Manage users (admin) |
| Namespaces | /namespaces | Manage namespace access |
Tips
Customizing Dashboards
Every dashboard can be customized:
- Click “Add Card” to add new cards
- Drag cards to rearrange them
- Click the menu on any card to configure or remove it
- Use the reset button to go back to defaults
Stats Blocks
The stats at the top of each dashboard show the most important numbers. You can configure which stats appear by clicking “Configure stats”.
Auto-Refresh
All dashboards auto-refresh by default. You can:
- Toggle auto-refresh on/off
- Manually refresh with the refresh button
- See when data was last updated